infrastructure/structured-logs-why-a-line-of-json-beats-a-sentence-when-something-bre.md
Structured logs: why a line of JSON beats a sentence when something breaks at 3 a.m.
A plain log line like "order 404 by alice took 87ms" reads well to a human, but a search for 404 also matches order numbers and the middle of 4040ms.
This article shows how structured logs (one JSON event per line, with named fields) let you ask exact questions: which requests returned status 404, what one user did, what took over a second. Try the same question against both formats in the interactive, then run the short Python examples yourself.
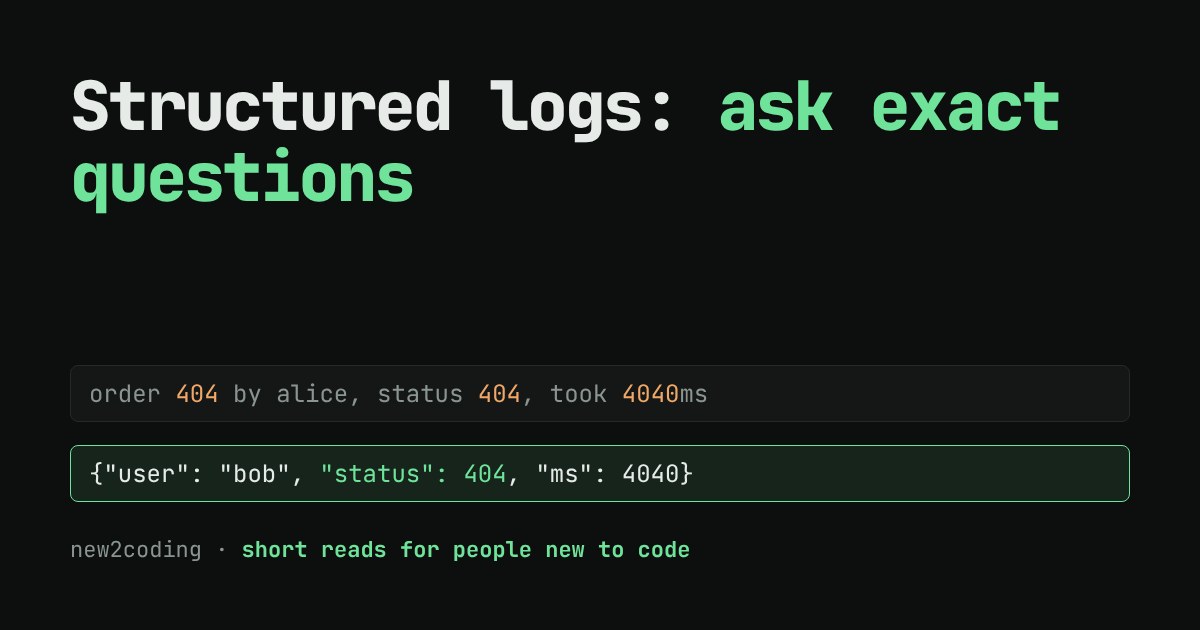
You ship a small shop. At 3 a.m. something breaks, and all you have is a file of log lines: the notes your program writes about what it is doing. The question is not whether you have logs. It is whether you can ask them a question and trust the answer.
A sentence is easy to write and hard to search
The first log line most beginners write looks like this: print("order 404 by alice took 87ms"). It reads nicely to a human. But a computer sees one long string of characters, with no idea which part is a name, which is a number, and which is an order.
So when you search for the text 404, the search matches every place those three characters appear: an order number, a web error code, the middle of 4040. The search tool is not wrong. You asked it for characters, and you wanted a meaning.
Structured logs: one event, named fields
A structured log writes each event as data instead of a sentence. The most common format is JSON (a way to write named values as text: {"user": "alice"}), one event per line. Python's built-in json module can do it:
import json

def log(level, msg, **fields):
    print(json.dumps({"level": level, "msg": msg, **fields}))

log("info", "order placed", order_id=404, user="alice", ms=87)
log("error", "payment failed", order_id=405, user="bob", status=404, ms=4040)
Running it prints:
{"level": "info", "msg": "order placed", "order_id": 404, "user": "alice", "ms": 87}
{"level": "error", "msg": "payment failed", "order_id": 405, "user": "bob", "status": 404, "ms": 4040}
Now order_id and status are different names for different things. The number 404 appears in both lines, but it means something different in each, and the names say which.
Try asking both kinds of log the same question
Below is the same set of events written two ways. Pick a question, then switch between the two formats. In plain text you can only search for characters. In structured you can ask about a field. Green lines are real answers. Orange lines are wrong answers the search returned, and dashed orange lines are real answers it missed.
Why the structured version wins
Three things change once events have named fields.
Exact questions. e.get("status") == 404 matches the field called status and nothing else. The user alice-smith is a different person from alice, and an exact comparison knows that.
Numbers stay numbers. "Took more than a second" is e["ms"] > 1000. In a sentence, 2300ms is just text; you cannot ask whether it is bigger than anything.
Tools can read them. Log services, dashboards and command-line tools such as jq understand JSON lines, so counting, grouping and charting come free. Here is the same idea in a few lines of Python:
import json

lines = [
    '{"level": "info", "msg": "order placed", "order_id": 404, "user": "alice", "ms": 87}',
    '{"level": "error", "msg": "payment failed", "order_id": 405, "user": "bob", "status": 404, "ms": 4040}',
    '{"level": "info", "msg": "page viewed", "path": "/missing", "user": "erin", "status": 404, "ms": 12}',
    '{"level": "warn", "msg": "slow query", "user": "alice", "table": "orders", "ms": 2300}',
]

print("lines containing '404':", sum("404" in line for line in lines))

events = [json.loads(line) for line in lines]
print("events with status 404:", [e["user"] for e in events if e.get("status") == 404])
print("slow events (ms > 1000):", len([e for e in events if e["ms"] > 1000]))
Output:
lines containing '404': 3
events with status 404: ['bob', 'erin']
slow events (ms > 1000): 2
Searching for the characters finds three lines. Asking for the field finds the two that are real 404 responses. json.loads turns a line of text back into a Python dictionary, and from there it is ordinary code.
What to put in each event
You do not need a special library to start. A few habits go a long way:
Give every event a short, stable msg such as "payment failed", and put the changing details in fields instead of gluing them into the sentence. Include the identifiers you will want to search by, like user or order_id. Use a level (info, warn, error) so you can look at only the serious events. And keep secrets out: never log passwords, card numbers or access tokens, because logs get copied to many places.
Python's standard logging module can also produce JSON output with a custom formatter, and many teams use a ready-made package for that. The principle is the same as the ten lines above.
So what for your own code
Next time you write print(f"user {name} did {thing}"), ask what you will want to search for later. If the answer is "a name" or "a number", give it a field. It costs almost nothing today, and at 3 a.m. it turns "scroll and squint" into one precise question.